

6 Things To Know About Stock Market Crashes and Downturns
The regularity of market crashes and declines is a reminder that patience is key to investing in equity markets.
Here we go again.
From December 2021 through mid-June, the U.S. equity market was down about 20% in real terms.
This is not the first time I’ve written about large stock market declines, which has included articles on the coronavirus crash and the history of market crashes among others.
Lessons Learned From Stock Market Declines
I’ve seen several themes emerge when it comes to these large stock market declines:
- From time to time, stock markets go through long and deep periods of decline.
- After a large decline, it is hard to predict how long it will take for stock markets to recover.
- Over the very long run, stock markets have been very generous to investors who can get through long periods of decline.
- During times of a rapid and deep decline, investors should avoid panic selling.
- The standard bell curve is an inadequate model of stock market returns. A model that can capture the extreme risks of the equity market (its “fat tails”) is needed.
- Sometimes, the market and economy move in opposite directions.
How Frequent Are Stock Market Crashes?
Let’s take a closer look at those occasional periods of stock market declines.
The chart below uses real monthly U.S. stock market returns going back to January 1886 and annual returns over the period 1871–85, which I originally compiled for Laurence B. Siegel’s 2009 book, Insights Into the Global Financial Crisis.
Following convention, I use the term bear market to refer to a downturn of 20% or more. Each downturn is indicated with a horizontal line, which starts at the episode’s peak cumulative value and ends when the cumulative value recovers to the previous peak.
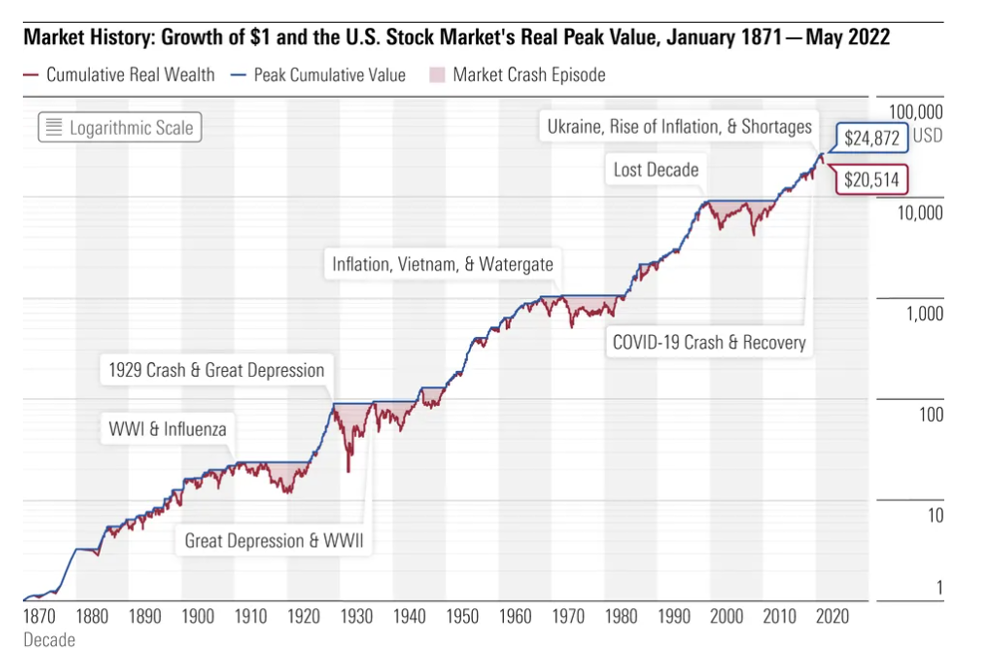
As you can see in the chart above, the 152-year record of U.S. market returns is littered with bear markets; in each case, the market eventually recovered and went on to new heights.
Indeed, this proved to be the case most recently in 2020. After a decline of 20% (in real terms) from December 2019 to March 2020, the U.S. equity market fully recovered in just four months and was back to its precrash level by July, soon pushing higher.
This market recovery is evidence of the second lesson about stock market declines: One can never predict how fast a recovery will be.
New Heights After Market Downturns
An investor who stayed in the market through these extreme downturns has been well-rewarded, so far.
The chart above shows that despite the downturns, some of which were quite long and severe, $1 invested at the end of 1870 grew to $20,514 in real terms at the end of May 2022. This is a real annual rate of return of 6.8%.
Think back to when the market bottomed out in February 2009. From then through May 2022, it was up 424%. Even after the additional drop that took place during the first part of June 2022, and made the current drop an official bear market, the market is up by 409% from February 2009.
Recall when the market had plummeted in January 2020. From then through May 2022, it is up 18%. Even after the additional drop that took place during the first part of June, the market is up by about 14% from January 2020.
Not All Stock Market Declines and Recoveries Are the Same
Below is a list of the 22 worst market declines in the nearly 152-year history of the U.S. stock market.
The table shows the month at which the cumulative value peaked before the decline, the month at which the stock market decline was at its worst (the trough), and the month in which it reached the previous peak.
Not surprisingly, the largest decline occurred with the crash of 1929 when the cumulative value dropped by 79% and took four and a half years to recover. (This recovery was short-lived. It was followed by an almost 50% decline, the fifth-largest decline on our list.)
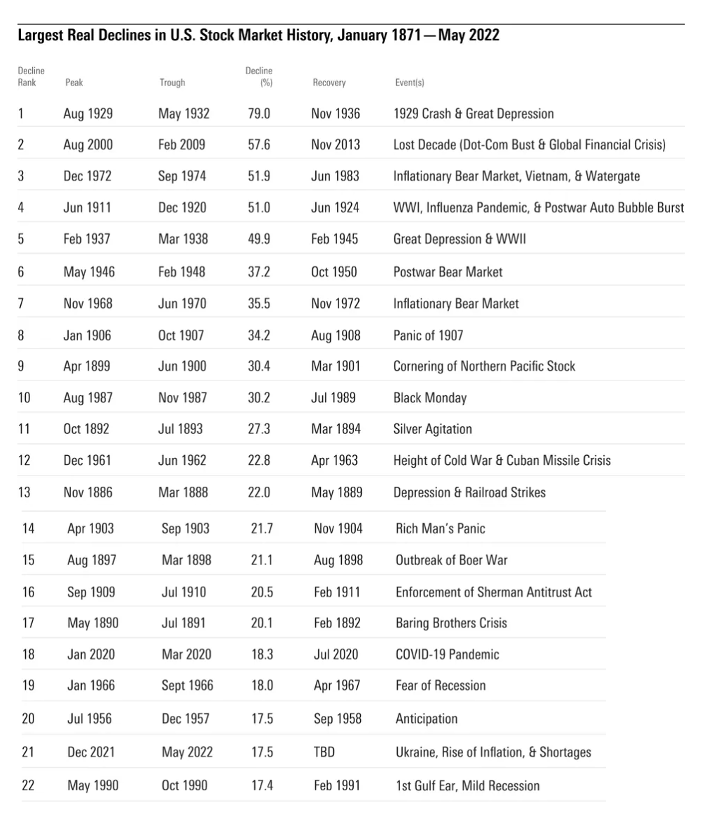
In more recent memory was the second-largest decline of 57.6%, which occurred during the 2000s. That decade started with a crash, followed by a near recovery, but then experienced another crash—the global financial crisis.
To put things in perspective, note that the decline of 18.3% (the 18th on our list) that started with the onset of the novel coronavirus pandemic took only four months to recover, though the pandemic lasted
far longer. This shows how the market can at times be disconnected from the real world, and it's a stark reminder that the stock market is not the economy.
As of May 2022, the current stock market decline stands at 17.5% and is 21st on our list.
At this point, we don’t know how severe this current market decline will be, how long it will last, or how long it will take to recover. But if history is any guide, prudent long-term investors who can withstand the risks of equity investing should stay the course and not panic.
Lessons Learned From the History of Stock Market Crashes and Downturns
At the time of a market crash or downturn, of course, we couldn’t have known that would prove to be the case—which is why some investors panicked and sold off their stock holdings.
It just goes to show the unpredictability of markets. Not all crashes are alike in their severity and duration, and naming the market’s peak or bottom is difficult. Therefore, the best bet is to prepare now for the next crash by owning a well-diversified portfolio that fits one’s time horizon and risk tolerance.
What I wrote more than two years ago rings truer than ever: “Market risk is about more than volatility. Market risk also includes the possibility of depressed markets and extreme events. These events can be frightening in the short term, but this analysis shows that for investors who can stay in the market for the long run, equity markets still continue to provide rewards for taking these risks.”
Equity Investing Can Be Quite Rewarding, But One Must Understand the Risks
One reason the risks and potential awards of equity investing are often misunderstood is that standard models of equity returns are based on the bell curve.
In a bell-curve model, it is virtually impossible for there to be the sort of extreme returns that are largely responsible for the deep declines and large runups that we see in market history. In other words, bell-curve models lack the fat tails (the extreme returns on the ends of the curve) that we see in historical returns.
Understanding the historical record should help investors get through the current downturn. And if this downturn is like all the others in the past 150-plus years, investors will be richly compensated.